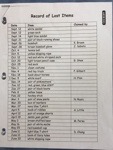
First students looked at a list of objects.
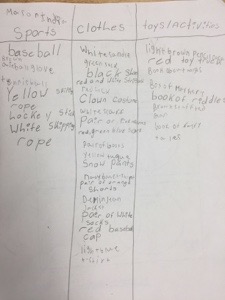
Then they used a variety of ways to organize the data. They talked about appropriate categories.

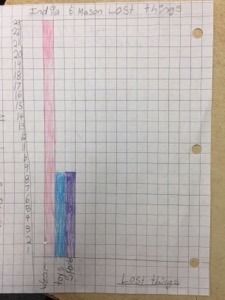
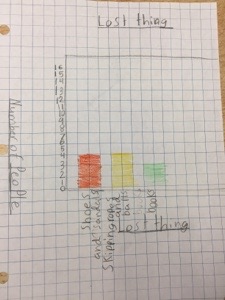
Then students used a bar graph to display their data.
First students looked at a list of objects.
Then they used a variety of ways to organize the data. They talked about appropriate categories.
Then students used a bar graph to display their data.
Take a look at the picture below.
How many dots?
How do you see them?
We all see math in different ways. Describe what you see in the picture and how. How many do you see? Do you see any patterns? Use the math vocabulary you know.
